TABLE OF CONTENTS
Building an Account Hierarchy Model | Census

Sean is co-founder and Chief Product Officer (CPO) at Census. He loves enabling data-driven organizations, so he's energized by introducing the world to Data Activation. San Francisco, California, United States
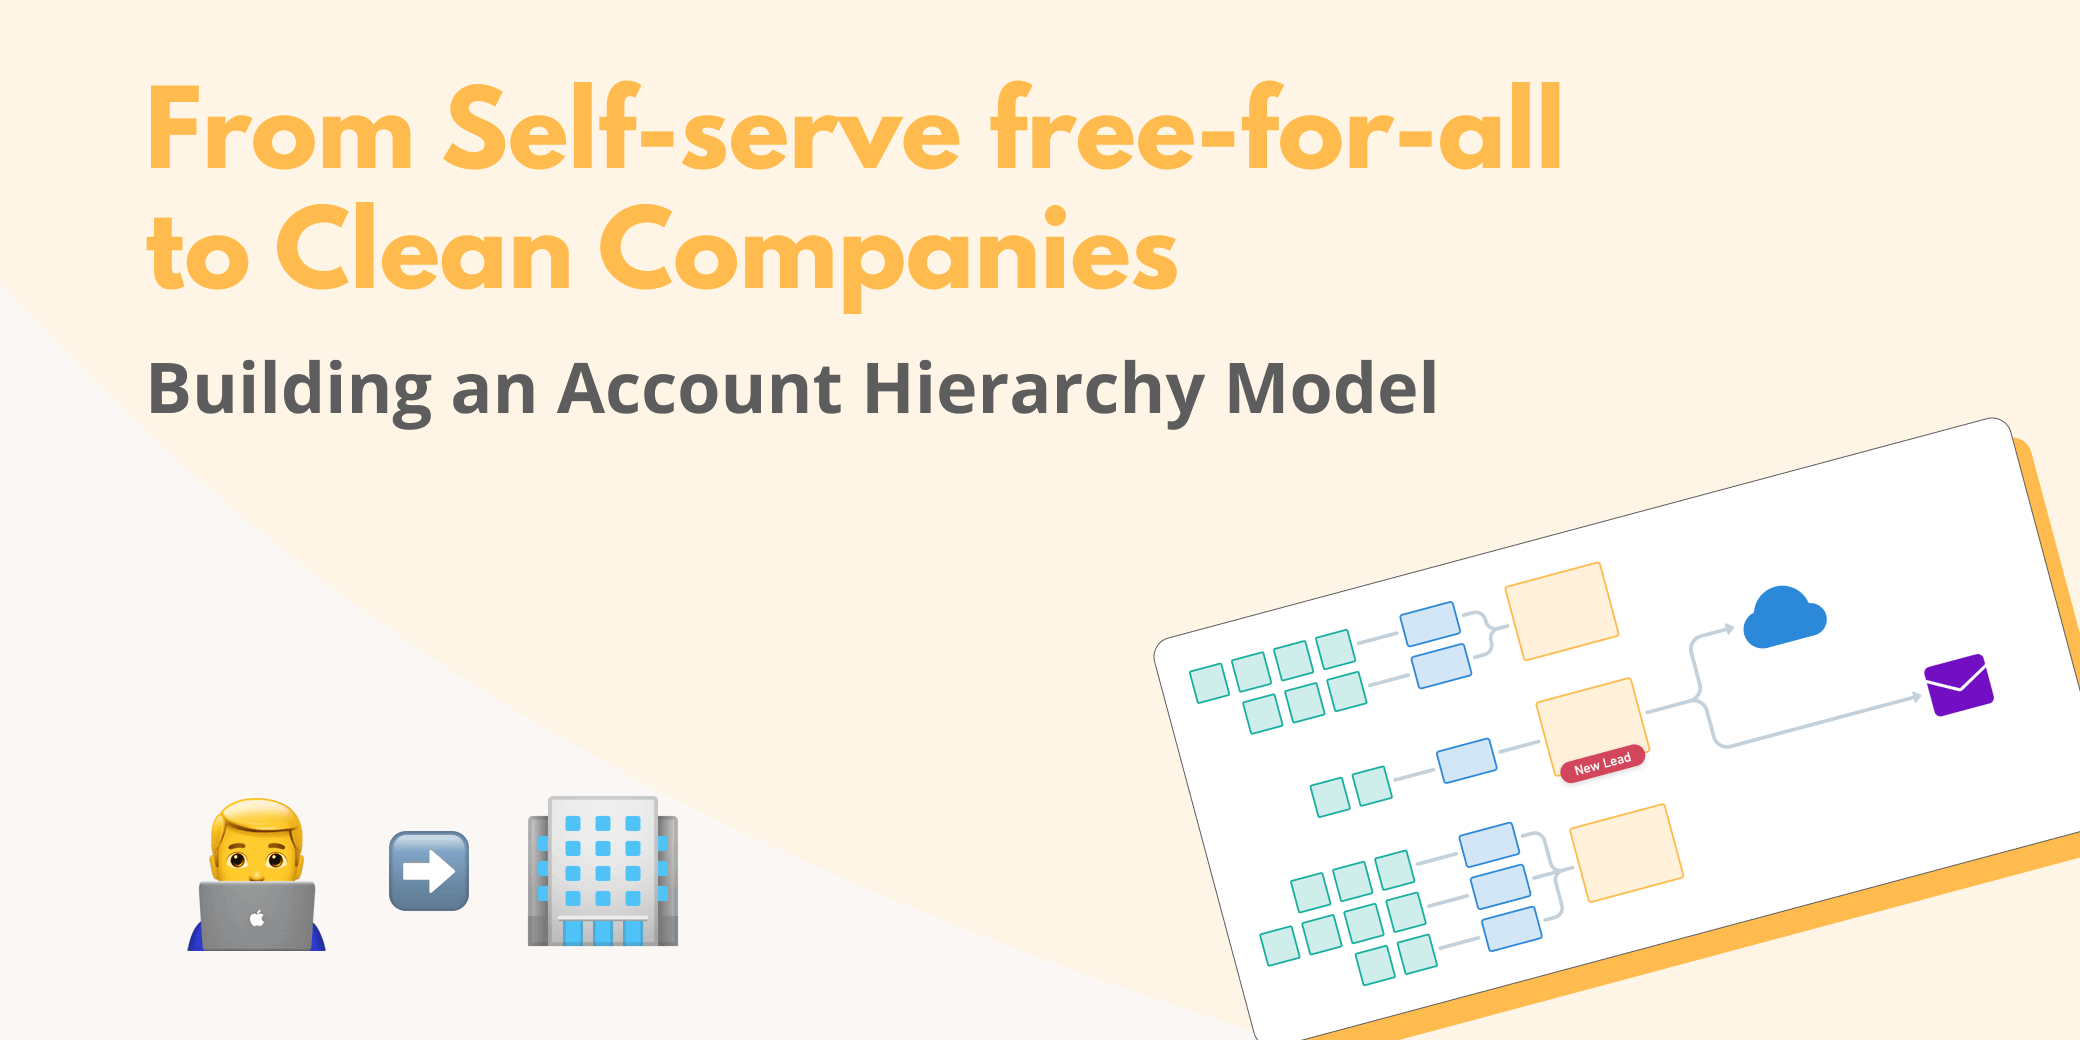
Bottoms-up growth is a buzzy go-to-market technique right now. From the exciting self-service adoption of products like Figma to the record breaking growth of Zoom, products that enable individuals to adopt a tool without first having to talk to sales is a winning strategy. Customers get started faster, and because they understand the product, they don’t need to be marketed or sold to in order to make a purchase decision.
But these companies are finding that self-service adoption is only the first step in a customer journey. For the business to grow, individuals and teams adoption needs to eventually lead to enterprise sales. Sure, in the best case that happens naturally as excitement inside the company forces a CIO’s decision. More often than not though, it still requires traditional sales to step in.
The tricky part is that all that self-service usage data is messy. There’s nothing stopping people from signing up with personal emails or multiple people at the same company from signing up for their own teams, completely independently from each other. All of this easy adoption leaves you with multiple different teams and overlapping users, all working for the same employer. Cutting through the noise for Sales, Marketing, and Success teams requires bringing order to the chaos.
Today, we’ll talk through how you can structure product data into account hierarchies that are actionable, all within SQL and your Data Warehouse. Here's what we'll cover:
- How to identify companies
- Understanding your current product data model
- Aggregating product data into companies
- Using your new hierarchy
Identifying companies
It all starts by figuring out what real world companies are using your product. And in order to identify a unique, real world company, we need a reliable identifier. Unfortunately, that may not be immediately obvious if you’re just looking at a list of users that have signed up to start using your product. But we have one very obvious hint: domain names that appear in users email addresses.
Domain names are the easiest place to start building an account hierarchy. They’re easy for humans to understand and debug. And users are often providing them directly to you as part of their email address. Alternatively, you can also ask users to provide this domain as they’re signing up to your product.
To start building our account hierarchy of companies, we’ll create a set of all the domain names that appear in our database. There’s some obvious issues to this (A very common example gmail.com users) and we’ll address them along the way. So let’s see what domains we have.
Understanding your data model
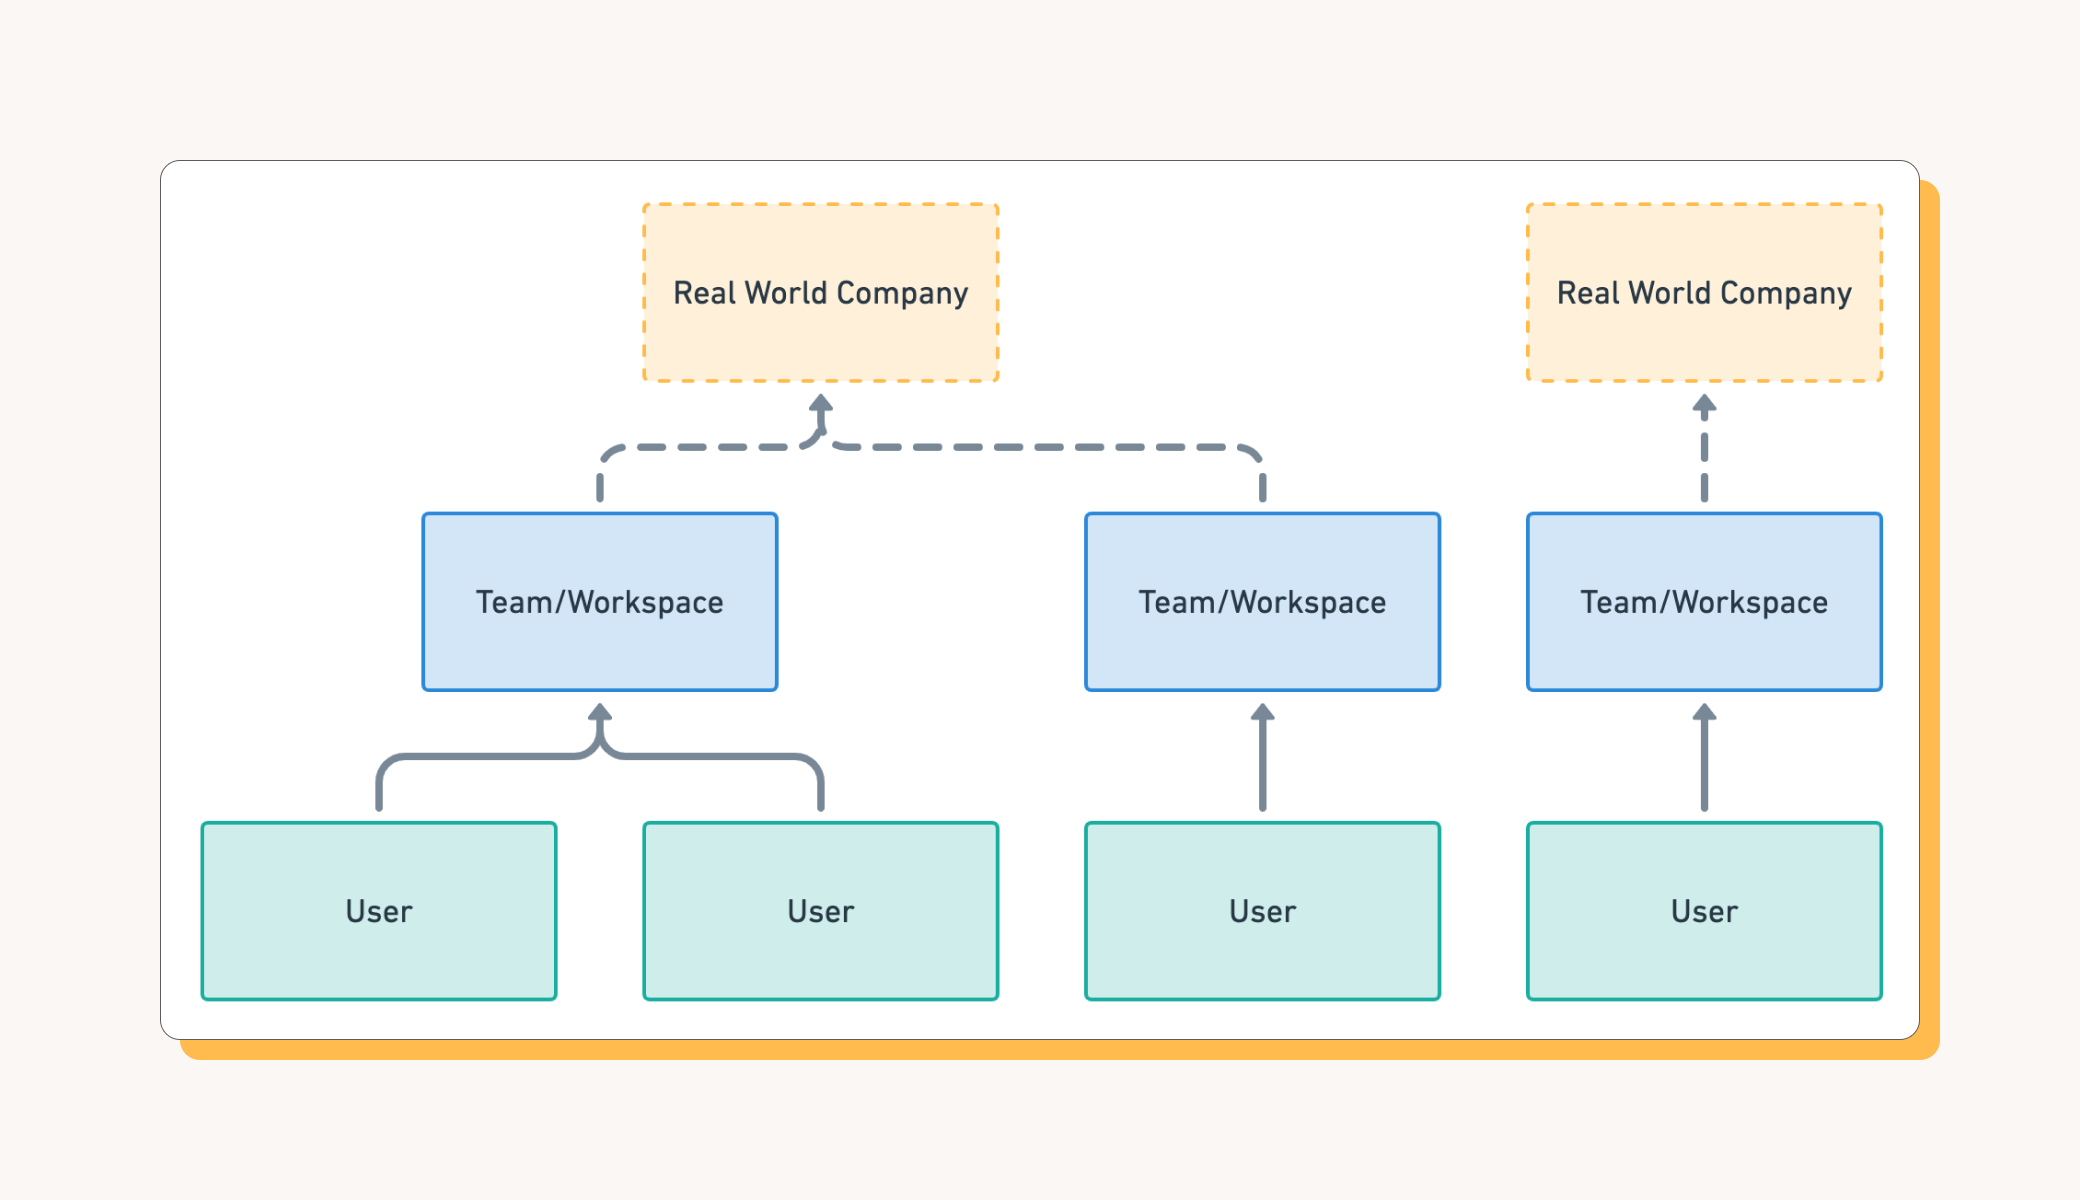
We’re going to be translating one model to the other so before we dive in, let's get a handle on what your data looks like currently and where it’s located. It may be spread across a few different tables, it may not even be in your data warehouse (you do have a data warehouse, right?).
One thing to keep an eye out for: does your product have a workspace concept? You might call it an organization, a group, or a team. This group is a really powerful hint we can use for identifying companies. If you do have workspaces, you’ll also need to know who is the “owner” of a workspace. This is typically the user that created it, but you may have a better identifier such as admin.
With your users and your workspaces, you can use some basic SQL to extract the domain from an email address. For each user and workspace, you now know which Company they belong to. We can use this to start aggregating our users.
Pro tip: You may have situations where companies are represented by more than one domain. In this case, you’ll want to add the ability to associate secondary domains to a primary domain as part of rolling up workspaces together.
Aggregating into Companies
The simplest hierarchy is
- GROUP BY domain
- COUNT(*) of users or workspaces
We’ve got the start of our account hierarchy. We can roll up more metrics from here. For each metric, it’s a matter of thinking about what sort of aggregation makes sense at the company level, ie SUM, AVG, MAX
What about personal email domain users like gmail.com or outlook.com? Well, that depends a bit on your business. You have three options, and the right option for you depends on what percentage of your user base use personal accounts
1) Ignore themThis is a completely reasonable option and the best place to start. Chances are, users that provided a personal email address are likely using your product for personal reasons. For example, someone using Notion to track their sourdough recipes are not going to be interested in Enterprise Single Sign-on features. So, you may want to just ignore them. You can do that by simply ignoring every domain in this comprehensive list of public email domains.
2) Roll up to a single accountYou could also translate all of the personal usage into a separate Public Email catch all company/account. This is a great strategy if you plan to connect these users/leads to other parts of your marketing automation and don’t need company information. If you’re planning on publishing this data to a CRM however, it’s really only worth while if you plan on having a human review the users that end up associated with this account.
3) Use firmographic data The most advanced option is incorporate firmographic data such as data provided by Clearbit, Zoominfo, or FullContact to translate a personal email address into an employer. Note that this data is not perfectly accurate so you may end up linking users to their previous employers or to someone completely unrelated to them.
Using your new hierarchy
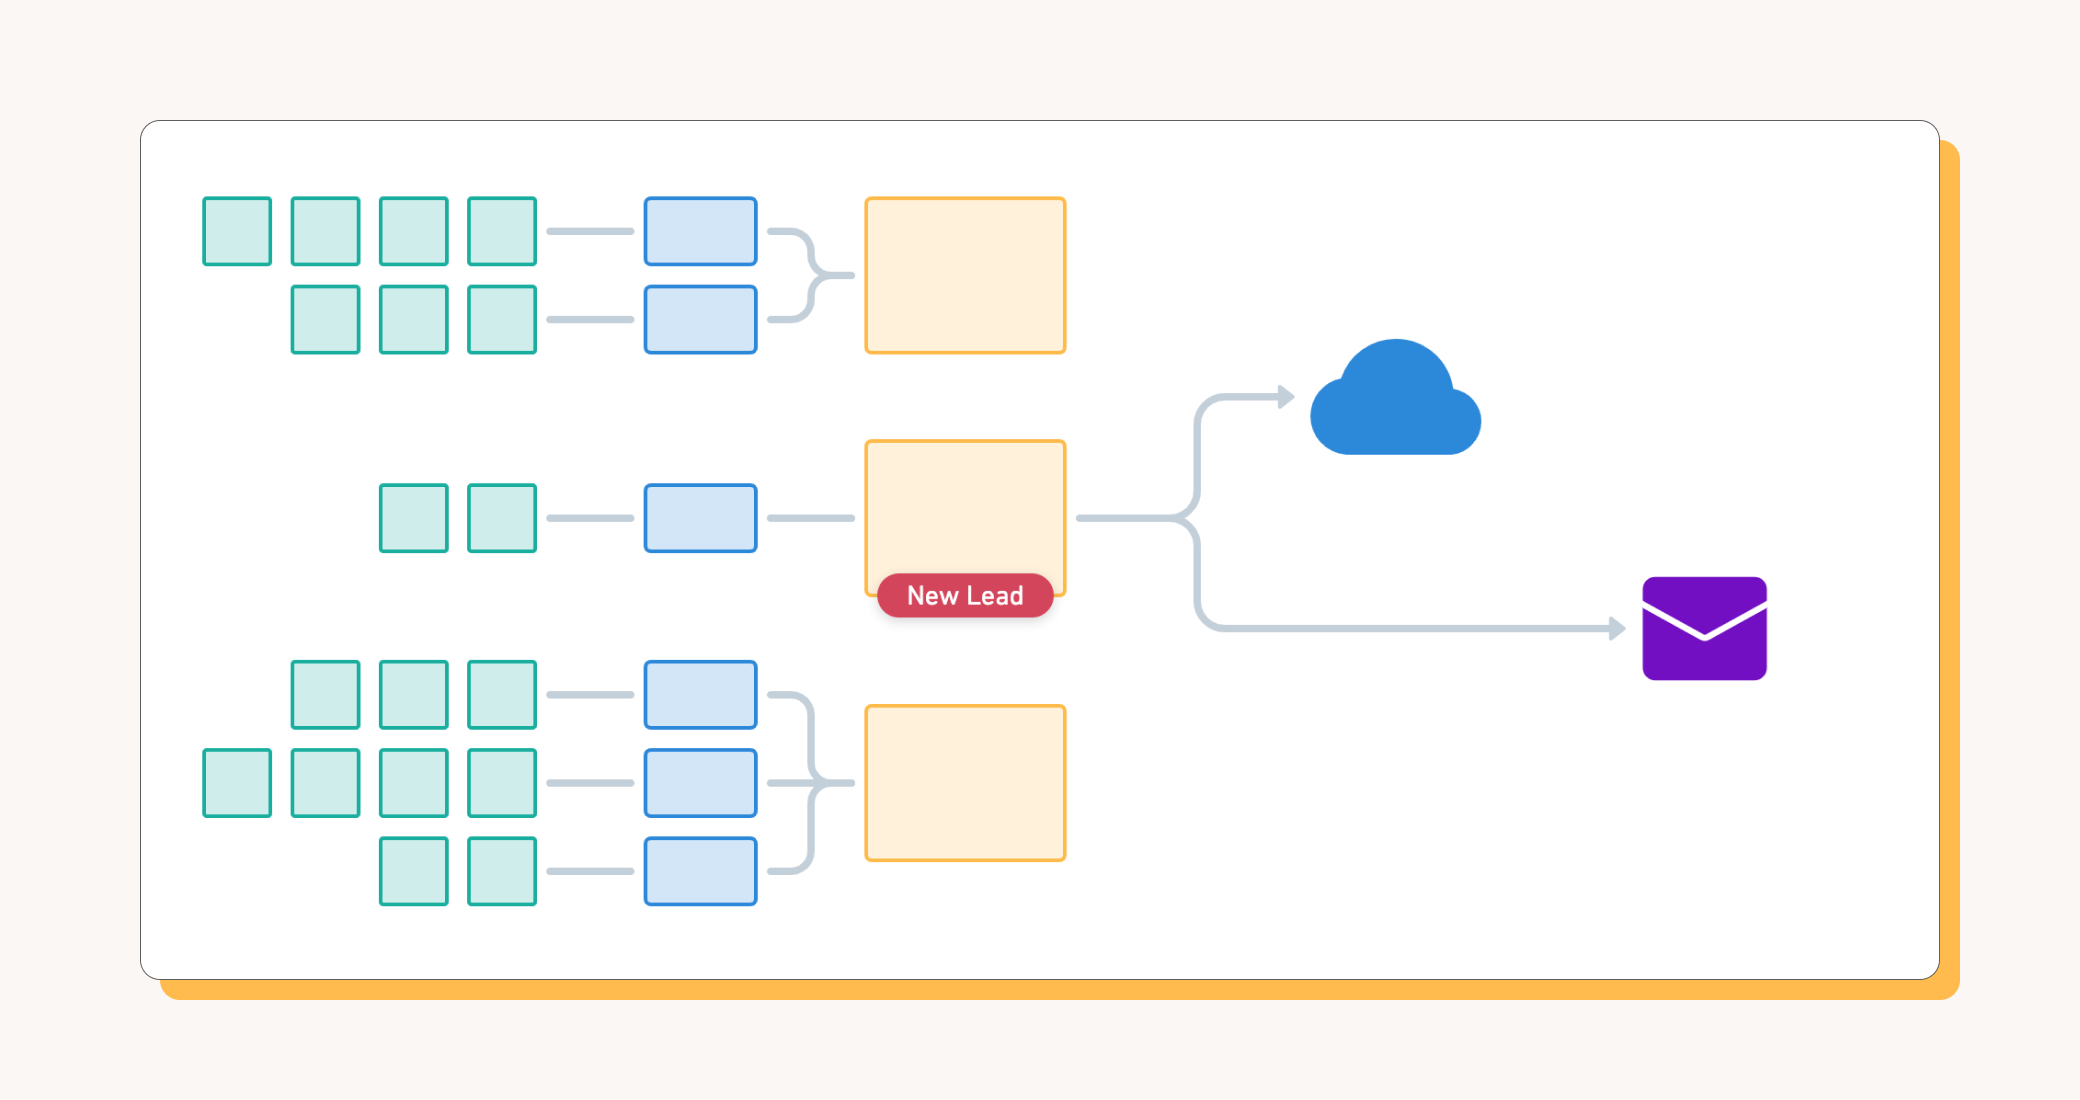
Now that you’ve got your Account Hierarchy up and running, you can start putting it to use. Census makes it easy to connect the data models you build in your Data Warehouse to the Sales and Marketing products you use to drive your Customer Journey, but how that journey unfolds is completely up to you.
What you’ve built is a Business Identity model that you can share across all of your products and tools. Census helps you associate this product model with all the other tools you use to serve your customer.
Here’s just a few ideas:
- Enrich your existing accounts and contacts with usage data - Use this data to give account reps context on what users are doing in product without searching across all your tools
- Identify net new logos - Use the data to identify companies that are actively using the product but are not yet in your CRM. Congratulations, you now have product qualified leads!
- Orchestrate Sales and Marketing at the same Account-oriented goals - Account Based Marketing requires Sales and Marketing to target the same accounts, but not necessarily the same contacts within those accounts. Use your new account hierarchy to share target lists between both sales and marketing
The sky’s the limit! This is meant to be a data platform you can build upon. Add more product metrics, incorporate data form other SaaS tools and more. We’re excited to see what you do with your account hierarchy. Keep an eye on this space for more customer success stories and other tricks to get the most out of your product data.
If you have any questions, contact me! I always move geeking about these data problems.
